As practising good debugging techniques and tools helps you solve your problem at once. Here are few of the mentions which I personally follow.
The basics :
When working with Ruby on Rails you will have to learn a lot of stuff to master debugging your own application. There are so many moving parts in a Rails app, it’s not just MVC…
- Views (Partials, Layouts, Templating-Engines)
- Controllers (Actions, Filter)
- Models (Relations, AREL, Callbacks, Database-Systems)
- Mailers
- Routes (REST, HTTP-Verbs, Constraints)
- Environments and Initializers
- Caching (Redis, Memcached)
- Assets (CSS, SASS, JavaScript, CoffeeScript, Pipelining)
- Bundler and dependency management
- Tests (RSpec, Capybara)
- gems, plugins and engines used in the app
Because of this overwhelming complexity, it is very difficult to keep in mind all the stuff and the flow of actions happening. Better way is to say Halt and let me see what are you upto.
Using rake:
Rake was intended as a Make for Ruby. It’s basically a build-tool that handles tasks. So make sure you know when it can be useful for you! The basic commands arerake -T to get a list of public commands and `rake -D` to get the full description of the tasks. If one of the commands fail, you can pass the --trace option to see what rake is doing under the hood and find possible error causes.Here is a list of useful commands that I use when running into strange errors during development:
1 2 3 4 5 6 | rake routes rake middleware rake assets:clobber rake assets:clean rake tmp:clear rake log:clear |
Reading stack-traces:
Reading traces means you have to be Bond - James Bond by nature B-)Traces leads you to the root cause or atleast to the cause which is making the code fail (thats what detective do in their day-to-day life). Providing meaningful error messages is one of most neglected parts in writing maintainable software. You should always read the errors and stack-traces because they contain helpful information like the source file and the line number where an error was caused. It even provides information about the context, like the calling object and the call-stack when the error happened.
Let me give you an example exception:
1 2 3 4 5 | undefined local variable or method `role' for #<Cucumber::Rails::World:0xc4722f8> (NameError) ./features/step_definitions/event_steps.rb:10:in `create_visitor' ./features/step_definitions/event_steps.rb:14:in `create_user' ./features/step_definitions/kid_steps.rb:107:in `/^I am exists as a parent$/' features/manage_kids.feature:11:in `And I am exists as a parent' |
What I can see at a glance:
- it’s about cucumber
- we are in a step definition
- the context object is of class
Cucumber::Rails::World - there should be a
rolebut it is not available - calling
create_visitorcaused this error - the source of
create_visitoris inevent_steps.rbon line 10
1 2 3 4 5 6 7 8 9 | # event_steps.rb def create_visitor @visitor ||= { :email => "user@example.com", :password => "test123", :password_confirmation => "test123", :role => Role.find_by_name(role.to_s) # this is line 10 } end |
It is just an excerpt of the code, so it’s a good idea to add real line-numbers or an anchor so other people know where we are. In this example, this would not even be necessary, because role is only called once. Without knowing anything about the source, I can immediately see that the author wanted to use something that is not there.
So possible solutions to this might be to use @role or maybe @visitor.role or to have a method called role or pass it in as a parameter to that method. If the test has run successfully before doing any changes, the error was probably introduced by some changes you did and should be easy to find.
So always make sure your test suite passes before writing new code.
Side Note:
Never throw away exception information unless there is a good reason! Swallowing exceptions causes a lot of pain for people that have to maintain the running application, so please at least log the error message when yourescue from something.Reading code:
One of the key skills for writing code is reading code in the first place. Whether it is code I wrote some time ago, code of my coworkers or library code. It’s super important to understand the code at hand and the code that my application is executing. Compared to other languages, where one has to deal with compiled sources, it’s incredibly easy to have a look at ruby sources. I often runbundle open some_gem to look at the source or when you are not using bundler run gem env and look at GEM PATHS where your gems are installed1 2 3 4 5 6 7 8 9 10 11 | gem env RubyGems Environment: - RUBYGEMS VERSION: 2.1.5 - RUBY VERSION: 2.0.0 (2013-06-27 patchlevel 247) [x86_64-darwin12.4.0] [...] - GEM PATHS: - /Users/paule/.rbenv/versions/2.0.0-p247/lib/ruby/gems/2.0.0 [...] subl ~/.rbenv/versions/2.0.0-p247/lib/ruby/gems/2.0.0/gems/rails-4.0.0/ |
Debugging the running server:
I sit in front of the browser and reload the page to see if something happens… Unluckily it does not work the way I expected, so what to do next?Find it in the logs..
When I am working on a Ruby or Rails application i like to run stuff in terminator with split views. One session for running spec, rails or the console and one session with the corresponding logs withtail -f log/development.log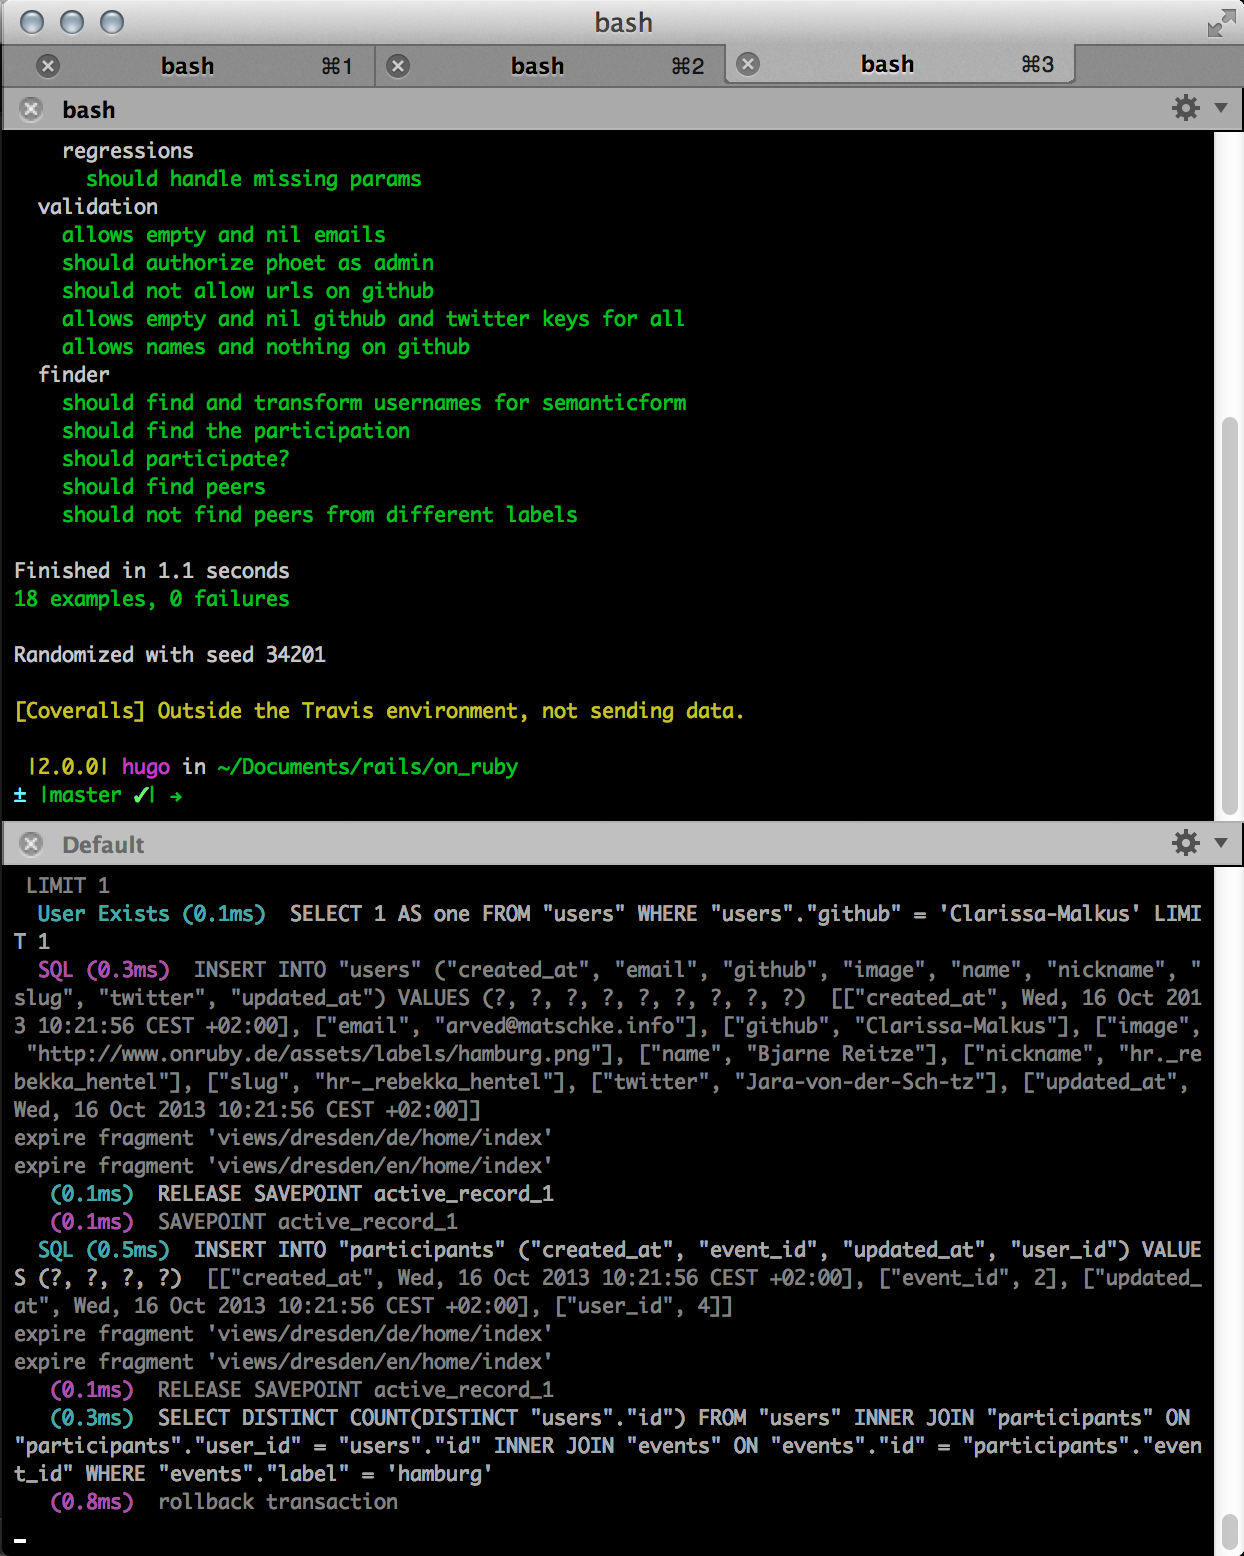
Logs help with a lot of stuff and are a powerful tool to debug your running code. Things that can be extracted from the logs:
- direct error information
- error-messages
- complete stack-traces
- logged warnings or errors (attribute accessible warnings, deprecations)
- context information
- request parameters
- request types (html, json, xhr…)
- response codes
- sql queries
- rendered views and partials
- callback informations
One thing to pimp the logs to be even more useful is to use the tagged logger that was introduced in Rails 3.2. It allows you to put even more context information into the log like the session-id and request-id:
1 2 3 4 5 6 7 | # application.rb config.log_tags = [ :host, :remote_ip, lambda { |request| "#{request.uuid}"[0..15] }, lambda { |request| "#{request.cookie_jar["_on_ruby_session"]}"[0..15] }, ] |
Quick inspects:
There are a couple of “workflows” which I tend to use in my everyday debugging, starting with simply addingp some_object, puts some_object.inspect or logger.debug some_object calls randomly to the code. For view templates i use = debug(some_object).This helps in about 50% of the error cases because it gives me enough context to find the problem quickly.
Another thing is putting a
raise some_object.to_s into
the code. This is especially helpful if I want to find out when and how
some part of the code is executed. Callbacks are a good example where
this is a nice shorthand method for debugging.Insight tools:
A running Rails server can provide a lot of useful information for debugging, especially if you curry it with the right helpers. Rails 4 already comes with some better error reporting and a route helper that can be accessed through navigating to an unknown route. I use the/routes path for this purpose: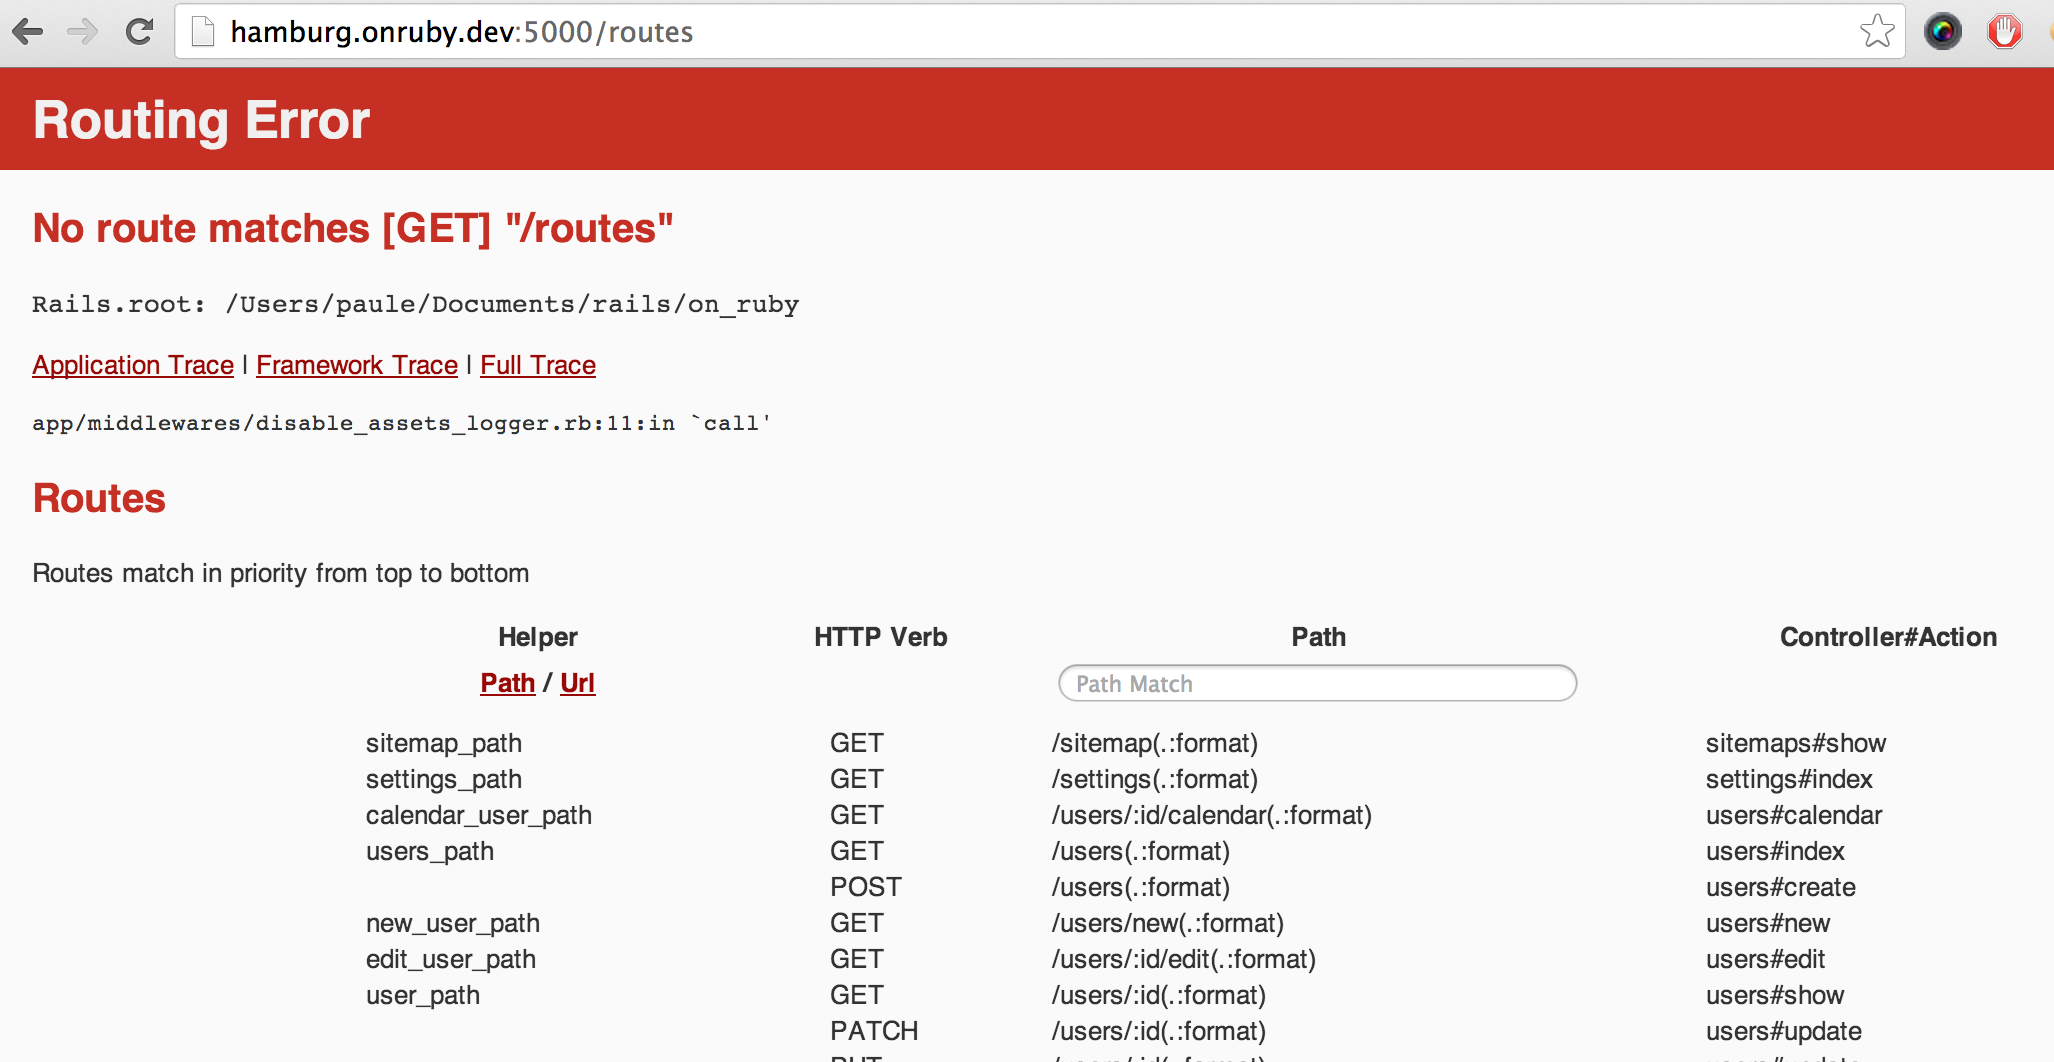
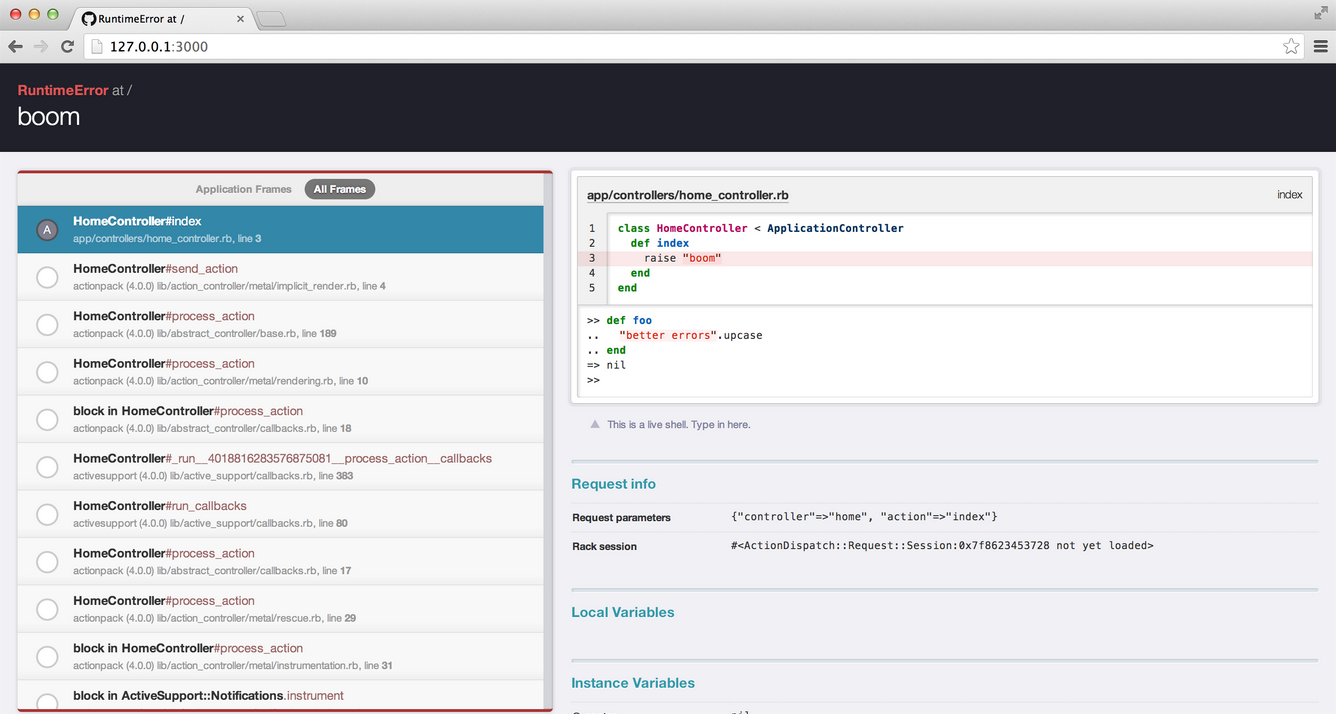
This functionality can be improved with a nice UI and a mini Rails console running in your browser if you add Better Errors and the Binding of Caller gem. These tools allow you to dive right into the error context and find out what might have went wrong. Combining this with raising my own errors gives me a lot of flexibility to quickly get to the point where I assume that something fishy is going on in the code.
When you are doing a lot of ActionMailer related stuff, you probably want to install the Letter Opener gem to develop and inspect your E-Mails.
The debugger:
Having tools like Better Errors is super nice, but they are only suited for usage in the Browser. This is not always possible and I fall back to real debuggers that allow for moving around in the call-stack and inspecting objects at runtime.The ruby-debug gem was the go-to-guy for a long time in Ruby land. It was a PITA to get this up and running in latest Ruby versions. That’s why I use the IRB replacement pry with a lot of extensions like pry-debugger or pry-nav. If you want to hook into a remote Rails process (ie. running rails via foreman) you can hook into it with pry-remote. Have a look at the Pry Railscast for more information.
Debugging through the console:
The console is very important for me when writing new or changing existing code. I often create new finders and scopes in the console directly. A very important command in the console isreload!. It reloads all the code in the current session, similar to what happens when you hit CTRL+R in the browser:1 | reload!; something_i_changed_in_the_editor.check_if_it_works
|
A thing that I find very helpful when stuck in a debugging session is the
method.source_location functionality introduced in Ruby 1.9. It allows me to see where a method is defined:1 2 | user.method(:url).source_location => ["/Users/amit/Documents/rails/on_ruby/app/models/user.rb", 39] |
I like to use pry-rails as my default Rails Console. It enables me to browse source code, inspect objects and do a lot of other crazy stuff. Just type
help in a pry session to see what commands are available. My favorite command is wtf? which shows the last raised exception and stack-trace.Debugging through testing:
I love test driven development! It is an everyday part of my programming routine. The only thing that I hate when doing TDD in Rails is the slow feedback loop. I don’t like using tools like spork or zeus as they introduce a lot of complexity and make debugging even harder.So my approach to get away with minimal turnaround time is to start my new expectations by writing somthing like this:
1 2 3 4 5 | describe User do it "does crazy stuff" do pry end end |
This rspec expectation will just open a new pry session where I can start coding right away, exploring my test with direct feedback from executing the code I want to test. This eliminates all the iteration- and startup time when running red/green cycles. It is especially useful when I don’t know exactly how something should function in the first place…
Debugging capybara:
The last pattern is super useful when writing acceptance tests in capybara! I always forget how to use capybara expectations and matchers, because I write only a few of those tests. This is mainly due to the test pyramid and me being a backend developer.There are also a lot more moving parts in acceptance tests, especially when running JavaScript tests in a headless browser. It’s super useful when you can just check
page.body or temper with X-PATH expressions directly in the pry session.If there is some strange behavior during test execution, I just put a breakpoint somewhere in the test and call
save_and_open_page or even better: print out current_url and open the running test instance directly in the browser!Other helpful tools:
The Rails ecosystem comes with a lot of tools for debugging, but it can be enhanced even further:Rails Panel:
If you are using Google Chrome like me, you can use the Rails Panel plugin in combination with the Meta Request gem to get a Rails Developer Console in your browser. Super sweet!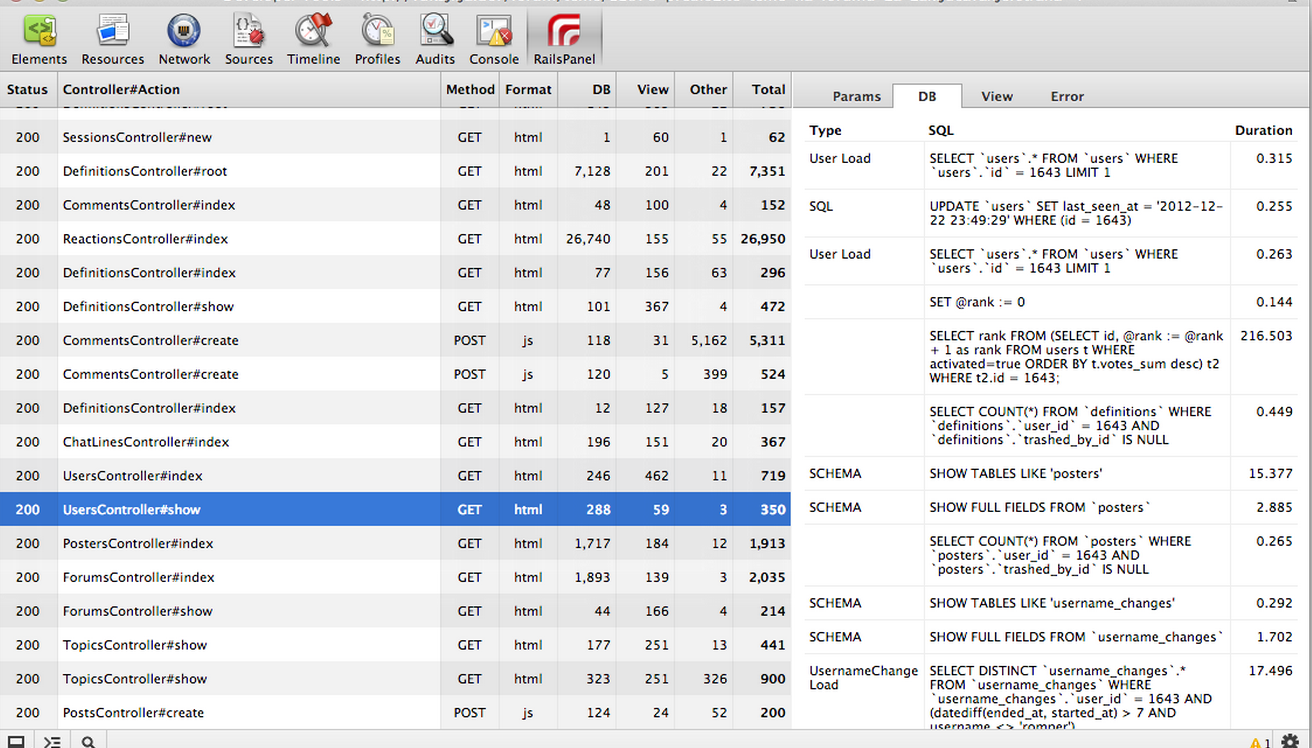
cURL:
If I want to look into response headers or other request/response specific information, Use
curl in addition to the Chrome Developer Tools:1 2 3 4 | curl -I "http://hamburg.onruby.dev:5000/" HTTP/1.1 200 OK [...] |
It is even possible to use the “Copy as cURL” option in the Chrome Developer Tools to get all the parameters necessary to redo some request!
Navicat:
Use Navicat as a multi db frontend. It allows to inspect what is going on in the database, check query results, indices and create data on the fly. Always have a good client for your data stores available!
GIT:
Havent used git, but want to. It’s not the most self explanatory tool on the planet but it helps when debugging applications. Just one example here is using
git bisect.
It executes a command for a range of commits, so that it is possible to
find out which commit introduced a problem.